The Power Rankings take the golf stats I have collected playing APBA Golf and boil them down into a single score, so you can tell at a glance whose card is playing the best golf right now, and whose has been the best over the long haul.
There are four kinds of Power Rankings I use and write about in other posts: Career and Last 10 Power Rankings, a pair for each gender. More about these below.
This post walks through how that single number gets built, why there are two separate versions of it, why men and women are ranked separately, and what any of it actually tells you about playing APBA Golf.
The raw ingredients
Every round a golfer plays gets logged, hole by hole, and rolled up into per-golfer averages based on the season printed on their card. Five of those averages feed the Power Ranking:
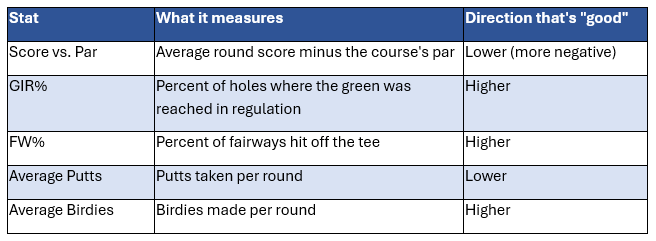
These five stats aren’t weighted equally. Score vs. Par — the closest thing to a bottom-line result — counts for 35% of the final score. GIR% counts for 20%. Fairway accuracy, putting, and birdie-making each count for 15%. That weighting is a judgment call about what matters most for a good golf card: shooting a low score matters more than any single ingredient that produces it, but the ingredients still matter.
Turning five different scales into one score
The problem with combining these five stats directly is that they’re not on comparable scales. A golfer’s average putts might range from 28 to 34, while GIR% might range from 20% to 70%. Adding those together as-is would let GIR% dominate the score just because its numbers are bigger, not because it’s actually more important.
To fix this, each golfer’s stat is converted into a “how far from typical, and in which direction” number — statisticians call this a z-score. Concretely: take the golfer’s stat, subtract the average for the whole pool of golfers being ranked, and divide by how spread out the pool is (the standard deviation). A golfer sitting exactly at the pool average scores 0. A golfer one “typical spread” better than average scores +1. One typical spread worse scores −1. Because every stat gets converted this way, they all end up on the same scale and can be safely combined.
Score vs. Par and Average Putts get an extra flip: since lower is better for those two, the z-score is negated before it’s added in, so that “better” always points in the same direction as GIR%, FW%, and birdies.
The five z-scores are multiplied by their weights (35/20/15/15/15) and summed, then stretched out and shifted so the result reads like a familiar-looking score: multiply by 10 and add 50.
A golfer at the exact average of the pool lands at 50. Most golfers land somewhere in the 30s through 70s; only the very best or very worst cards drift much further from that range. This is purely cosmetic — it doesn’t change anyone’s rank — but it makes “72” feel more like a golf score and less like a statistics output.
Career vs. Last 10 Power Rankings: Two different questions
The dataset produces two separate Power Rankings for every golfer, and they answer different questions.
Career Power Rankings use every round a golfer has ever played. This is the “who has the strongest card, full stop” ranking — it rewards sustained performance across a golfer’s whole history and isn’t swayed much by a single hot or cold stretch.
Last 10 Power Rankings use only each golfer’s ten most recent rounds within a season. This is a “form” ranking — it answers who’s playing well right now, not who’s been good historically. A golfer having a breakout stretch can shoot up the Last 10 rankings well before it moves their career numbers at all, and a golfer coasting on an old reputation can fall out of the Last 10 list even while their career ranking still looks strong.
Both rankings use the same five stats and the same weighting formula. The only thing that changes is which rounds get averaged before the formula runs, and — because a “last 10” pool is inherently smaller and choppier than a career pool — the two rankings are computed against separately calculated pool averages, so a golfer’s Last 10 score is only ever compared against other golfers’ recent form, not against their career norms.
Why men and women are ranked separately
Men and women are never compared against the same pool average. Each Power Ranking — Career and Last 10 alike — is computed twice: once using only men’s rounds to set the pool average and spread, and once using only women’s rounds. A women’s GIR% of 55%, for instance, is measured against what’s typical for women in the dataset, not against the men’s pool.
This matters because comparing z-scores only makes sense within a comparable group. If men’s and women’s rounds were pooled together before computing averages, differences in the two pools’ typical scoring, driving distance, and green-reaching ability would show up as an artifact of the pooling rather than as a meaningful signal about any individual golfer’s game. Ranking within gender keeps the comparison apples-to-apples: a golfer’s Power Score reflects how they stack up against their own comparison group, not against a pool with a different baseline.
The two groups also use slightly different minimum-round thresholds before a golfer qualifies for a ranking at all. As of this writing, men need at least 4 career rounds and at least 4 rounds in their last-10 window to qualify; women need at least 4 career rounds but only 3 in their last-10 window. (Both are subject to change as I play more rounds.)
That one-round difference exists for a practical reason, not a competitive one: the women’s pool has fewer recorded rounds to draw from, so a 4-round minimum on the Last 10 side would have excluded golfers who are otherwise active and trackable. Lowering the bar to 3 rounds keeps the qualifying pool large enough to be meaningful without watering down what “qualified” means for the men’s side, where round volume supports the stricter cutoff.
Choosing the minimum number of rounds required
How the minimum gets set in the first place is a balancing act between two competing problems. Set it too low and the rankings fill up with golfers whose averages rest on one or two rounds — a single hot round can swing a 2-round average by several strokes, which produces a z-score that says more about luck than about the card. Set it too high and the leaderboard shrinks to a handful of heavily played golfers, leaving out cards that are genuinely active but haven’t accumulated much volume yet.
The threshold I use is the lowest number that still makes a golfer’s averages hold reasonably steady when one more round is added: currently, below about 3 or 4 rounds, adding a single round noticeably reshuffles the order; above it, new rounds mostly nudge scores rather than reorder them.
That’s why the number is expressed per pool rather than as one global rule. Each threshold is set against the round volume actually available in that pool — men’s career, men’s last 10, women’s career, women’s last 10 — so the cutoff sits just above the noise floor for that specific group instead of importing a standard from a better-populated one.
As the dataset grows, the thresholds are meant to rise with it: once most golfers in a pool clear 8 or 10 rounds, a 4-round minimum stops doing any filtering work and the bar can move up without excluding anyone worth ranking.
What this means for APBA Golf players
Because the underlying stats — FW%, GIR%, putts, birdies, score vs. par — are the same ingredients an APBA golf card is built from, the Power Ranking is effectively a leaderboard of card strength. A golfer with a high Career Power Score has a card that, across a large sample of simulated rounds, should play consistently well: good ball-striking, reliable putting, and a scoring average that holds up over time.
A golfer with a high Last 10 score but a middling Career score has a card that’s currently performing above its long-run tendencies — worth watching, but not yet proven over enough rounds to say it’s a true shift rather than a hot streak.
That distinction is useful for anyone drafting golfers, seeding a bracket, or just deciding which card to trust in a big simulated match: Career rankings tell you which cards have the deepest, most reliable track record; Last 10 rankings tell you which cards are trending hottest right now. Neither one is “more correct” than the other — they’re answering different questions about the same underlying card.
A few limits worth keeping in mind
The Power Score is a descriptive ranking, not a probability or a prediction. A score of 72 doesn’t mean a golfer will shoot a particular number next round — it means their recent averages sit well above the pool’s typical performance across the five weighted categories. The ranking is also only as good as the round volume behind it: golfers near the minimum-rounds threshold have noisier averages than golfers with dozens of rounds logged, even though both are treated the same way by the formula once they qualify.
And because the weights (35/20/15/15/15) are a fixed design choice rather than something derived from the data, a different reasonable weighting scheme would produce a different — though probably similar — ranking. The formula is a consistent, transparent way to combine five real performance stats into one number; it’s not a claim that this is the only correct way to do it.