APBA Golf recreates real professional rounds on cards, translating actual scoring, driving, and putting performance into a dice-driven simulation. Every card represents one player’s statistical output for a given season (more or less) — which means power rankings aren’t opinion polls, they’re math. Run the numbers across hundreds of cards spanning more than 150 years of golf, and some clear patterns emerge about who dominates the board and why — provided you remember that those 150 years are sampled very unevenly, with recent seasons supplying most of the data.
What the Power Score means
Each entry in the rankings blends score-to-par, fairways hit, greens in regulation, putts per round, and birdie average into a single Power Score, indexed so the average card — man or woman — lands at 50. The men’s dataset covers 506 cards for 243 different golfers, from Tom Morris, Sr.’s 1864 card up through the 2025 season card set. The women’s dataset is smaller: 120 cards for 78 golfers, running from 1950 to 2024.
Caveats that affect how to read all of this
My dataset, albeit large by APBA Golf standards, is nowhere near evenly distributed across seasons, and that shapes almost every pattern below. Coverage of the All-Time Greats is thin and selective — often a single card for a marquee player in a marquee year — while golfers from more recent seasons appear multiple times, with large fields represented for 2020, 2022, and 2024. Recent seasons therefore make up a substantial majority of the data on both the men’s and women’s sides.
Two consequences follow. First, any season that contributes a lot of cards will dominate the extremes of the board simply by having more entries in the draw, at the top and at the bottom alike. Second, the historical cards that do exist are mostly best-of-era seasons rather than a representative cross-section, so the older card-seasons enter the dataset pre-filtered for excellence. Neither effect is a flaw in the Power Score itself, but both mean era comparisons here describe the dataset, not the sport.
Unrelated to these statistical factors is also the fact that these rounds were played on courses of unequal difficulty and under variable weather and course conditions. In addition, all the rounds of my four-round tournaments were played on the same courses, while my All-Time Greats tournament (of older players) was played on four different courses. Some player’s cards may be particularly well-suited (or challenged) for some courses but not others. In other words, golfers in my dataset weren’t “tested” in exactly the same ways.
What actually drives a high Power Score turns out to be pretty consistent across both genders. Score-to-par is the strongest single predictor (correlation of -0.97 for both men and women — lower scores mean higher rankings, as you’d expect), and birdie average is close behind (0.85 for men, 0.79 for women). Greens in regulation matters more than fairways hit for both groups. Putts per round barely moves the needle for the women’s rankings (-0.14) and only modestly for the men (-0.44), which suggests these cards reward players who set up birdie chances more than players who simply hole putts.
The Men’s Leaderboard: A modern trio out front
Three cards separate themselves at the top of the men’s rankings, and all three come from the same three-year stretch:
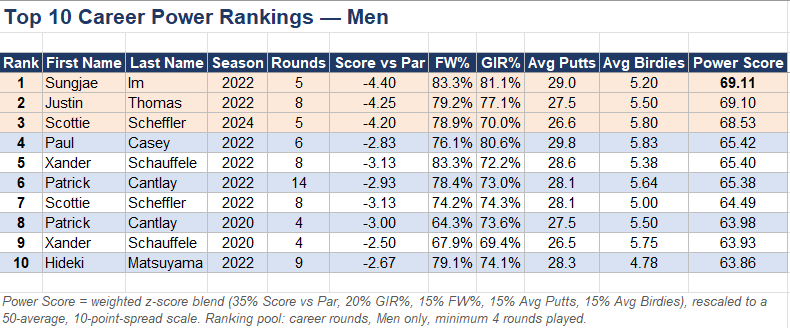
Sungjae Im’s 2022 card edges Justin Thomas’s by a hundredth of a point, but the more interesting story is how thick the 2022 season is at the top of the board — six of the top ten cards, and eight of the top fifteen, come from that single year. That is partly arithmetic rather than era superiority: 2022 is one of the most heavily represented seasons in the dataset, so it gets far more chances at the top ten than a season represented by two or three cards, and it fills much of the board’s upper reaches for the same reason it fills the middle.
Scheffler is the only player with multiple cards inside the top ten, and his 2024 card ranks above his own 2022 season, tracking his rise to world number one.
The rankings aren’t just a modern phenomenon, though. Arnold Palmer’s 1960 card (63.6) and Walter Hagen’s 1924 card (63.3) both crack the top 15 all-time, and they do it on a tiny fraction of the attempts the modern game gets — the pre-1990 scorecards contribute only a small fraction of all the records, so any historical entry in the top 15 is punching above its share of the sample.
That cuts both ways as evidence, though. It does not show the format is era-neutral, because the older cards in the set were selected precisely because those seasons were exceptional; a card set that included ordinary 1924 and 1960 seasons would almost certainly sit lower. Tiger Woods’s 2000 season, statistically one of the greatest in golf history, checks in at 62.7, a shade behind Rory McIlroy’s 2024 card (63.1) but well clear of his own 2019 comeback-season card (50.3, just a hair above the statistical average).
At the other end, the bottom of the men’s board is almost entirely recent: eight of the ten lowest-ranked cards come from 2019 or later, with Henry Cotton’s 1937 card (25.3) as the lone historical outlier sitting dead last. That is not a knock on today’s players; it is the same sampling effect that put 2022 atop the board, running in reverse.
Recent seasons supply most of the cards, including the marginal ones, so they necessarily own most of both tails. The older players have too few entries — and too favorable a selection of them — to appear at the bottom at all, which is why Cotton’s 1937 poor performance reads as an outlier rather than as one of a cluster.
The Women’s Leaderboard: Korda on top, Lopez holding her own across decades
The women’s rankings top out lower than the men’s (63.9 vs. 69.1), which tracks with a smaller, tighter dataset, but the story at the top is similar — and so is the caveat. The women’s set is if anything more lopsided than the men’s, with only a scattering of entries from the 1950s through the 1980s compared to the last few years which are represented in greater depth:
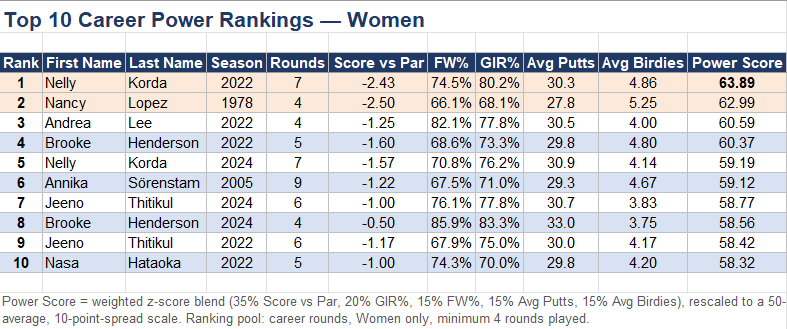
Nancy Lopez’s 1978 rookie-year card sitting at number two, nearly half a century after the fact, is the standout result in either dataset. It’s a reminder of just how dominant she was that season — Lopez won nine times, including five in a row, and that season-card still ranks ahead of every Annika Sörenstam and Lydia Ko season-card in the data.
It is also the clearest illustration of how the older cards enter the set. Lopez is one of only a few pre-1990 women’s entries, and she is there because 1978 was historically great, so her placement measures one exceptional season against a deep modern field rather than telling us how the 1970s LPGA scored on average. Nelly Korda is the only player with two cards in the women’s top five, and her 2022 season remains clearly the high-water mark of the dataset.
The bottom of the women’s board tells a slightly different story than the men’s — it’s not purely a modern-depth effect. Alexa Pano’s 2023 card (29.7) and Lydia Ko’s 2023 card (30.7) sit at the very bottom, but so do Susie Berning’s 1973 card (34.6) and Marilynn Smith’s 1963 card (37.2). Given how few older women’s cards exist, two of them landing in the bottom handful is a real signal rather than a rounding error: the women’s low end genuinely draws from across eras, and it is the one place in either dataset where the historical cards are not uniformly flattered by selection.
Men vs. Women, by the numbers
Averaged across every scorecard, the PGA and LPGA games in APBA seem to reward slightly different profiles — with the reminder that averaging across every card mostly means averaging across the past decade, since that is where the bulk of the data comes from. What follows describes the modern game with a light historical dusting, not an all-time mean.
Men’s scores average -0.7 relative to par with 60.7% fairways and 60.1% greens in regulation; women’s scores average +1.3 relative to par with noticeably tighter driving (69.3% fairways) but similar green-hitting (65.3%). Men’s cards also average more birdies per round (3.66 vs. 3.29) despite the smaller GIR gap, which lines up with birdie average being the second-strongest driver of Power Score in both datasets.
The men’s rankings are also more spread out — a standard deviation of 7.5 points versus 6.8 for the women — which is largely a sample-size result rather than a statement about league differences: with 506 cards versus 120, the men’s set has far more room to reach the extremes, and its wider historical span — from Tom Morris, Sr.’s 1864 card to Henry Cotton’s rough 1937 season — stretches the range further still. Compare like-for-like seasons and the gap would likely narrow.
What the depth chart says
Taken together, the rankings make a good but qualified case for APBA Golf as a cross-era measuring stick. The Power Score itself is era-blind — it rewards the same things, low scores and lots of birdies, whatever decade a card comes from — and on that common yardstick Vardon, Braid, Hagen, Palmer, and Lopez hold their own against Scheffler, Korda, and the rest of today’s stars. What the card set can’t yet support is the stronger claim that the eras are being compared on equal footing. The modern game shows up as full fields; the historical game shows up as its greatest hits. Until the older seasons are carded with anything like the same density, every era-level conclusion here is partly a statement about the sample and only partly a statement about the card ratings or the quality of the simulation.
Complete Power Rankings for the Men and Women can be viewed in the PDF below: