A little over six years ago, I began keeping records of my APBA Golf rounds–mostly played on my own but sometimes with others. In that time, I’ve compiled 3,868 of them with 1,100 different golfer cards. With all that data, I thought it might be fun to see who stacks up the best.
If you’ve spent any time rolling dice over an APBA Golf board, you already know the game rewards a particular kind of player: not just the one who can turn in a spectacular round, but one who grinds it out hole after hole. So, which cards, across every APBA Golf season in the database, actually produced the best statistical performance?
To answer that, I built a Power Rankings model. Every men’s golfer-season with at least three recorded rounds is scored on a weighted composite of five things that matter most to how (IMO) a card actually plays at the table: scoring relative to par (35% of the score), greens in regulation (20%), fairways hit (15%), putts per round (15%), and birdies per round (15%). Each stat is standardized against the full field, so a card doesn’t get credit just for playing an easy course — it has to actually outperform its peers.
I need to point out that my dataset has many more rounds for players from 2019 – 2025 (an average of 329 rounds/year). The next closest years are 2016 (137) and 1962 (54). No other years come close. As a result, you might expect more recent players to be represented near the top.
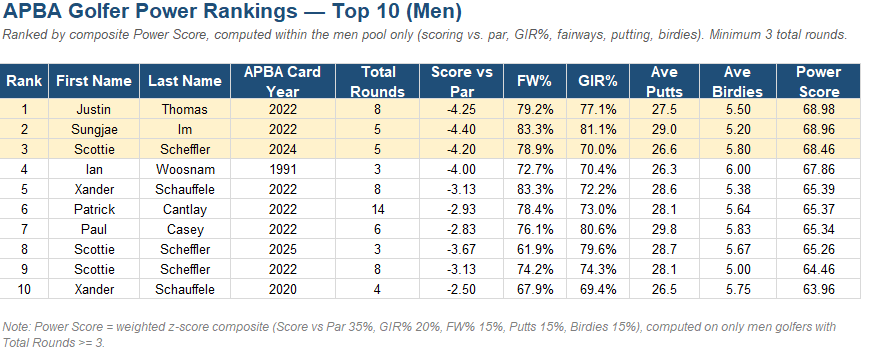
Here’s how the Top Ten shook out:
The Top 10
1. Justin Thomas, 2022 — Power Score 68.98 The number one card in the database, and it’s not particularly close in the components that matter: -4.25 to par, 79.2% fairways, 77.1% greens, and 5.5 birdies a round on just 27.5 putts. This is as close to a complete card as the game has produced — no real weakness to attack.
2. Sungjae Im, 2022 — Power Score 68.96 Separated from the top spot by 0.03 points, Im’s 2022 card is a razor-thin second. He actually posted the better scoring average of the pair (-4.4 to par) and the better GIR rate (81.1%), but a slightly heavier putter (29.0) is what keeps him a hair behind Thomas.
3. Scottie Scheffler, 2024 — Power Score 68.46 The first of three Scheffler seasons in the top ten — more on that below. The 2024 card is defined by elite ball-striking (78.9% fairways) paired with the best putting average in the entire top ten (26.6), a combination that’s brutally efficient across a full round.
4. Ian Woosnam, 1991 — Power Score 67.86 The lone pre-2000 card to crack the top four, and proof that this isn’t a “modern equipment” leaderboard. Woosnam’s 1991 season posted a scoring average of -4.0 to par on the back of the best birdie rate in the entire top ten (6.0 per round) — remarkable given fairway and green numbers that are modest by comparison to the cards above and below it.
5. Xander Schauffele, 2022 — Power Score 65.39 Tied for the best fairway percentage in the top ten (83.3%, matching Im), Schauffele’s 2022 card is the definition of a controlled, low-variance performer — hard to force into trouble off the tee.
6. Patrick Cantlay, 2022 — Power Score 65.37 The most heavily tested card on this list — 14 total rounds, nearly double most of the others — which makes a -2.93 scoring average and 5.64 birdies per round even more impressive. This isn’t a hot streak; it’s a sustained level of play across a much bigger sample.
7. Paul Casey, 2022 — Power Score 65.34 Casey’s card leans on the green — 80.6% GIR, the best mark in the top ten — and turns that into the second-best birdie rate on this list (5.83 per round), even with a fairway percentage that’s the lowest of the top seven.
8. Scottie Scheffler, 2025 — Power Score 65.26 Scheffler’s second appearance, and the most lopsided card in the top ten: a pedestrian 61.9% off the tee (by far the weakest fairway number here) offset by an outstanding 79.6% GIR. A reminder that on the table, missed fairways don’t matter much if the approach game cleans them up.
9. Scottie Scheffler, 2022 — Power Score 64.46 His third top-ten card, and proof of just how deep his file runs — three different seasons, three different statistical shapes, all inside the top nine cards in the game.
10. Xander Schauffele, 2020 — Power Score 63.96 Rounding out the list, Schauffele’s second appearance comes from a smaller four-round sample but holds its own: -2.5 to par with the best putting average of the pair (26.5) — evidence this wasn’t a fluke two years before his 2022 card also made the cut.
What the List Tells Us
A few things jump out once you line these ten cards up side by side.
2022 is strongly represented in the Top 10. Five of the ten cards on this list — Thomas, Im, Schauffele, Cantlay, and Casey — come from the 2022 season. However, a whopping 619 rounds were played with cards from that season. Of course, that’s no guarantee that these particular players would stand out–but it’s a good bet that some of the golfers from that year would.
Scottie Scheffler is the only golfer with three cards in the top ten — 2022, 2024, and 2025 — and each one gets there a different way, from balanced (2022) to putting-dependent (2024) to green-reliant (2025). If you want one golfer’s file to anchor a franchise-mode league, this is the file.
Birdie-making, not ball-striking, separates the elite. Every card in the top ten is elite in at least one of fairways or greens, but the common thread running through all ten is a birdie rate at or above 5.0 per round — and often well above it. On the table, that’s the stat that turns a solid card into a great one.
Old cards can still win. Ian Woosnam’s 1991 season holds its own against a field of cards three decades newer, finishing fourth overall. The model doesn’t care when the round was played — only how it was played relative to its own field. That should be reassuring news for anyone building a table with vintage cards mixed into a modern field.
Next time you’re deciding which card gets the tee box in a big match, you could do a lot worse than pulling one off this list.
But Wait — Where Are Nicklaus, Palmer, and Tiger?
Any time you publish a list like this, the same three names are bound to come up in the comments: Jack Nicklaus, Arnold Palmer, and Tiger Woods. Surely one of the greatest golfers of all time has a card in the top 10?
Not quite — but they’re not far off. Out of 569 qualifying men’s golfer-seasons, here’s exactly where their best cards land:
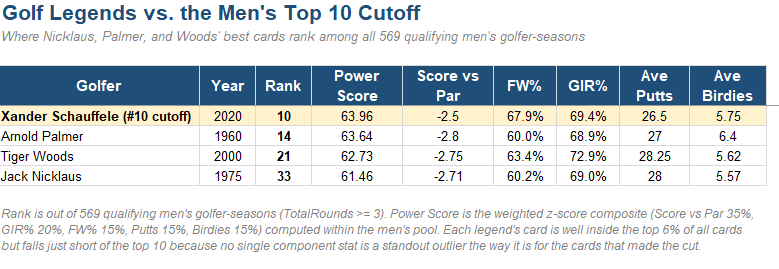
Palmer’s 1960 card is the closest miss of the three, just 0.32 points behind Schauffele for the #10 spot. His scoring average is actually better than Schauffele’s (-2.8 to par vs. -2.5) and he leads the entire top group in birdies (6.4 per round) — but his fairway accuracy, at 60.0%, is noticeably below the roughly 74% average of the top 10. In this model, fairway accuracy carries real weight, and it’s the one leg of Palmer’s stool that’s shorter than the rest.
Woods’s legendary 2000 season sits at 21st overall. His greens-in-regulation number is genuinely elite (72.9%, better than several top-10 cards), but his putts per round (28.25) and fairway percentage (63.4%) are both middling next to the very top tier, and a scoring average of -2.75 — very good, but short of the roughly -3.2 average posted by the top 10 — is enough to keep him outside the cutoff.
Nicklaus’s 1975 card lands furthest out of the three at 33rd. His scoring (-2.71 to par) and birdie rate (5.57) are both solid, but he’s essentially average-for-the-list across fairways, greens, and putts rather than exceptional in any single category — and the Top 10 is built from cards that post at least one truly standout number, not just an all-around good one.
The takeaway: the Top 10 isn’t simply “best scorers.” It’s cards that pair strong scoring with at least one elite, standout stat — a wall of fairways, a run of greens, a hot putter, or a barrage of birdies. Nicklaus, Palmer, and Woods are all comfortably inside the top 6% of every men’s card in the database (14th, 21st, and 33rd out of 569, respectively). They just each have one category that’s merely very good instead of exceptional — and at this altitude, that’s the difference between the Top 10 and the next tier down.