In this post I examine two putting factors: (1) using Regular Putting boards vs. Major Tournament Putting boards on overall putts per round and (2) using the Putting Probability Tool and Putting Probability Tool for Major Tournaments to assess whether there is an initial putting distance range at which strategies might change when using these boards. Both tools can be found on this site’s Downloads page.
In an earlier post on the Putting Probabilities for ATG Players, I used the Putting Probability Tool to rank the original 144 All Time Great players’ putting abilities based on two statistical criteria derived from their APBA cards and the Regular Putting boards. These are: (1) the probability of making putts from all possible distances when going for it and (2) the probability of 3-putting or (worse) from 20 feet or more when going for it.
How the APBA Putting Boards Work
The current game’s putting boards are referred to here as the “Regular Putting boards.” The APBA site provides for download a set of supplemental boards in PDF form called the “Major Championship Putting Chart,” which I refer to here as “Major Tournament Putting boards.” In both cases, a user of the boards has the choice to GO! for it or to play SAFE, until within 6 feet, where the only option is to go for it.
On initial putts, a strategy of playing it safe minimizes the chance of three-putting (or worse) at the expense of the chance of one-putting, which is maximized by going for it. Missed putts when playing it safe end up closer to the hole than when going for it at the same distance. Shorter putts have a higher probably of being made at all distances from the hole for both the Regular and Major Tournament Putting boards. The differences between these boards are that the Major Tournament Putting boards have the same or lower make percentages (across all distance columns) and that misses result in longer, less makeable subsequent putts.
The choice of playing it safe or going for it can depend on the situation at hand and is, at times, quite obvious. In match play, for example, a player one stroke down might be faced with sinking a putt to avoid losing the hole, thereby making go for it the only real choice. On the other hand, in stroke play, a player needing only two putts to win the tournament need not risk increasing the chance of a three-putt and should play it safe on that initial putt. Nevertheless, more often than not, a player is faced with a decision on a mid- or longer-range putt and must decide whether the opportunity is worth the risk, which is, in part, one motivation for this investigation.
Observations from Past Tournament Replays at Magnolia and Birthplace
My first use of the Major Tournament Putting boards in a tournament was at the 2022 Open Championship Replay at Birthplace (St. Andrews). In that tournament the replay qualifiers averaged 31.7 putts per round. The actual qualifier average was 31.8. Average strokes per round matched as well. The course and wind conditions of the replay event were very similar to the actual event.
For my replay of the 2016 Master’s at Magnolia (Augusta National), I used APBA’s recommended method of rolling for wind and course conditions, which did produce an easier challenge than faced by the players in the actual event. I also used the Regular Putting boards. In this replay the actual qualifiers shot 73.6 strokes per round, while the replay players shot 71.8. The most significant difference was in the putting (30.2 actual vs 27.1 replay—a difference of 3.1 putts per player round).
This significant difference made me wonder about APBA’s renderings of the Augusta National greens, which many writers have argued are some of the most challenging on the tour. Golf Digest presents an in-depth look at the unique challenges of these demanding greens. Magnolia does attempt to capture some of the complexity described in that article.
For example, Hole No. 9 has a false front that takes shots short of mid-green (Pin 2) perhaps off the green entirely. Hole Nos. 16 and 17 have shots landing back left rolling to mid-green left (Pin 3). Most greens are just straightforward, though, with no special terrain factors. Also, Magnolia has no rough around the greens, resulting in more accurate approach shots from just off the green compared to other Major venues, such as Seaside (Pebble Beach). Consistently shorter first putts mean fewer putts per round.
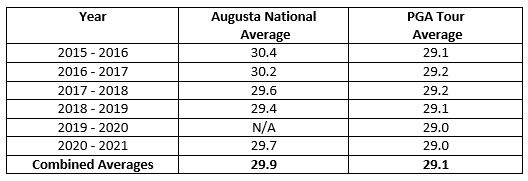
In recent years putting at Augusta National has been more difficult than the average course on the PGA Tour by about eight-tenths of a stroke as shown in the table below.

Estimating the Effects of Putting Boards on Putts per Round
Of course, the best way to test the effects of the Major Tournament Putting boards vs. Regular Putting boards would be to play two full tournaments with the same players on the same course under the same exact conditions. That’s a lot of work. I opted for a simpler, yet less precise method, using four representative players.
The golfers chosen were from the 2022 APBA card set: Rory McIlroy (16th Shots Gained Putting–SGP), Patrick Cantlay (28th SGP), Séamus Power (40th SGP) and Brian Harman (77th SGP). All four played in my 2022 Open Championship Tournament at Birthplace and are representative of the range of players who could potentially qualify for a Major tournament event.
For this investigation I played 24 rounds in total – 12 rounds each with the two sets of putting boards. All rounds were played on Magnolia using the original 2014 Master Game rules and Game Caddie 5.2.1. Day Wind was varied (Calm, Moderate, and Blustery) but identically matched between the two putting test conditions. All Course Condition rolls were set to Normal.
The outcome was as expected: The average number of putts per round with the Major Tournament Putting boards was 28.3 as compared to 26.4 for the Regular Putting boards—nearly a two-stroke difference. Because of the small sample size, we mustn’t get insistent about two strokes being the precise difference between the putting boards. On the other hand, I wouldn’t disregard that estimate either. If two putts per player were added to my 2016 Master’s Replay average of 27.1 putts per round, the 29.1 result would align quite favorably with actual tournament putting averages (as shown in the table above).
What Can Be Learned from the Putting Probability Tools?
The data for the following analyses were derived using the (Regular) Putting Probability Tool and the Putting Probability Tool for Major Tournaments.
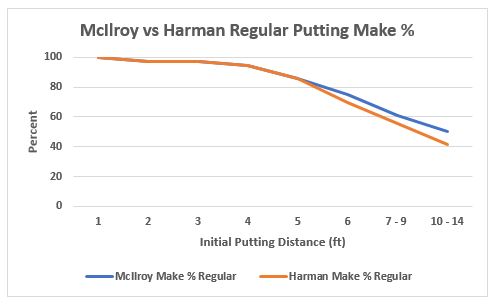
McIlroy (2022) and Harman (2022) provide examples of how the different putting boards can affect putting results and thus putting strategies. Let’s start by considering the difference in the capability of the putters themselves with respect to making “shorter” putts from 1 to 14 feet. Assuming these players go for it on all shorter putts, the chart below (based on the Regular Putting boards) shows that the make percentage declines more sharply for both players beyond 4 feet.

At 5 feet, both players’ make percentages drop to slightly above 80 percent. Thereafter, Harman’s make percentage declines faster than McIlroy’s, with Harman bottoming at ~40 percent and McIlroy at ~50 percent by the time they reach the 10 – 14-foot range.
There isn’t much a user can do with this information. It is merely provided to quantify how much better McIlroy is than Harman at making putts from 6 – 14 ft. A plot of shorter putts based on the Major Tournament Putting boards would show the same relationships, albeit with slightly lower make percentages in some cases.
The more relevant question from a strategic standpoint involves the distance at which a player should abandon going for it and just play it safe. That decision may be made obvious by the nature of the situation itself, such as needing to avoid 3-putting to win, as discussed previously. However, in more routine scenarios, we might want to consider whether the probability of making a one-putt exceeds the chance of making a 3-putt (or worse).
Having played many rounds of APBA golf, I have infrequently encountered a 4-putt and have only once managed to 5-putt (Keith Mitchell in the 2022 Open Championship Replay at Birthplace). Therefore, the downside risk is essentially about 3-putting.
One way to think about this topic is to consider a risk-reward scenario. Let’s define the upside (what we can gain) as the probability of making a 1-putt times one stroke (the reward), and the downside (what we can lose) as the probability of making a 3-putt times three strokes (the cost). When a player has more to gain than lose on average, then go for it.
Let’s say at a given distance that a player has a make percentage of 15%. That equates to 1 * 0.15 or an expected value of 0.15. Similarly, let’s assume at that same distance a player has a 5% chance of 3-putting or worse. That equates to an expected value of 3 * 0.05 or 0.15. In this example we have an equal chance of both outcomes, so the decision is more a matter of how you like to roll —”You’ve got to ask yourself one question: ‘Do I feel lucky?’ Well, do you, punk?”
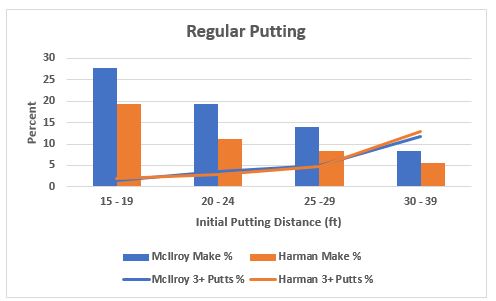
Looking at the Regular Putting boards, the chart below shows that on putts from 15 – 19 ft., the chances of making a 1-putt for both players are at least 3 times higher than the chances of 3-putting (or worse), so the smart play is to go for it for both players. From 20 – 24 ft., Harman is approaching the break-even point and might consider playing it safe. McIlroy, on the other hand, still returns a better expected value by going for it at that distance. From 25 ft. on, both players should play it safe to minimize their putts.

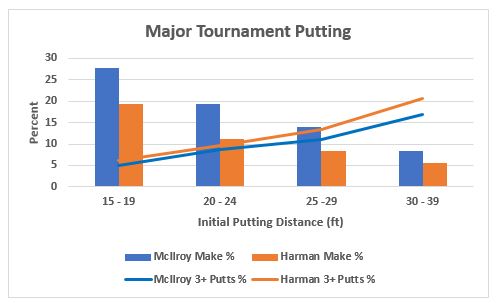
Now, let’s consider the Major Tournament Putting boards. The first thing we note is that at the ranges shown, the make percentages are the same as the Regular Putting boards. What changes are the chances of 3-putting or worse, which go up significantly on the Major Tournament Putting boards for longer putts. As shown below, from 15 – 19 ft., McIlroy should go for it, yet Harmon should consider playing it safe. Beyond 19 ft. both players should play it safe to minimize putts.

Summary
For those who enjoy replays, the Major Tournament Putting boards provide a way to increase putts per round to better match actual results on APBA courses that lack special green features designed to make them harder. For the most part, Magnolia is one of those courses.
Some other APBA courses have holes where you need to add a column or more of distance on certain putts, depending where the ball sits on the green relative to the pin. These requirements may affect only first putts or all putts on that particular hole.
Courses that make extensive use of these conventions may be served well by use of the Regular Putting boards. One way to decide is to check the average putts per round for the tournament of interest using the PGA Tour website. Unless the number of putts per round is above say, 29, you may not want to use the Major Tournament Putting boards to increase difficulty.
When using the Major Tournament Putting boards, my advice is to be cautious about going for it beyond 19 ft. The probability of 3-putting increases rapidly beyond that distance for even the better putters. With the Regular Putting boards, the same is true beyond 24 ft.
While there is a drop-off in make percentage after 5 ft. when using the Major Tournament Putting boards, there isn’t much you can do about it. However, you can reduce the chance of 3-putting or worse by adopting a less aggressive strategy on longer putts, especially for players who aren’t among the very best putters.