The first step in exploring the effect of APBA card ratings on performance is to look at the ratings themselves. This post examines ratings for the 2021 season. There are 80 players in that season set.
Here is a summary of what those ratings look like numerically:
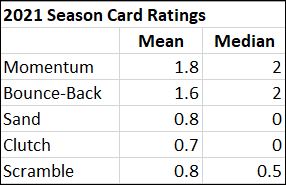
It probably makes sense to think of the median values as representative of the typical player, as will become more evident once you see the underlying distributions for these data. That means, the typical 2021 season card has 2 Momentum points, 2 Bounce-Back points, 0 Sand points, a Clutch rating of 0, and 1 or no Scramble points. If a card has higher numbers on any of these ratings, then that player is better than average in that category for that year (and vice versa).
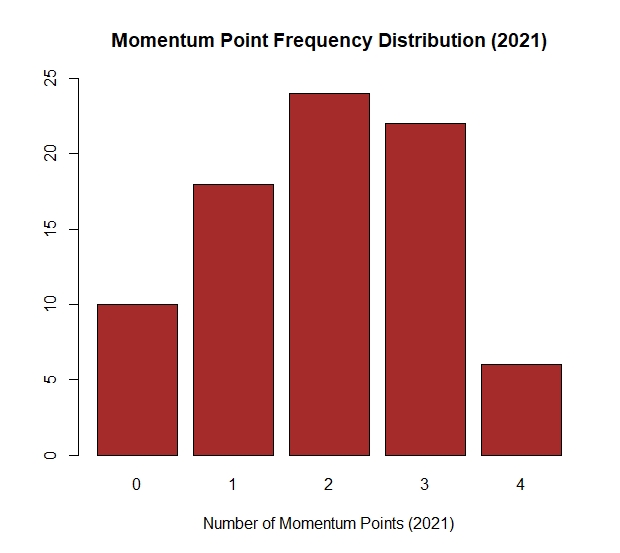
Here is the frequency distribution for Momentum points. Two points is most common but quite a few players have 3. Ten players have none.
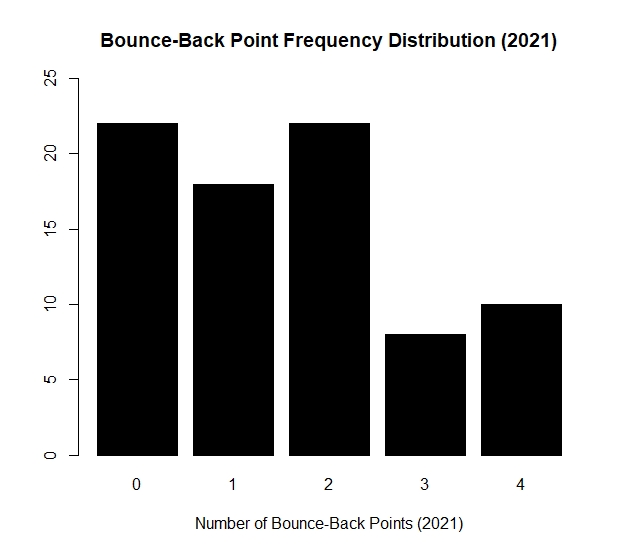
Next, we look at Bounce-Back points. Among players with points, two is the most frequent (22). But an equal number have 0 points. Cards with 3 or 4 Bounce-Back points are definitely better average in 2021.
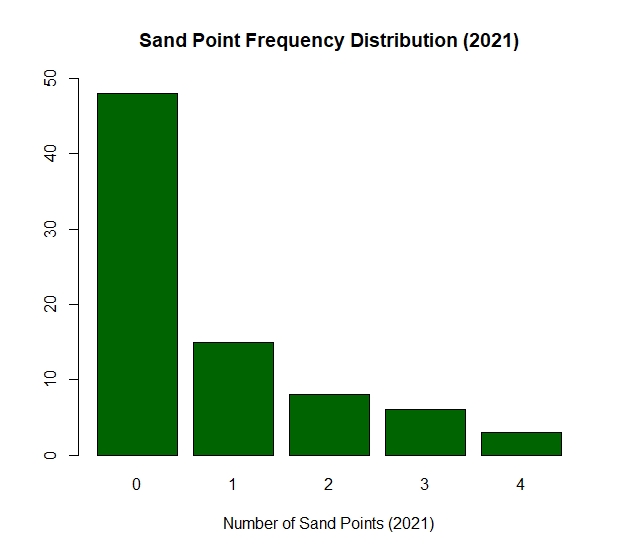
A clear majority of players have no Sand points, and only three have four points: Brooks Koepke, Xander Schauffele, and Cameron Smith, who in real life, finished first (65.38%), second (64.71%), and third (63.19%) in Sand Save percentage in 2021.
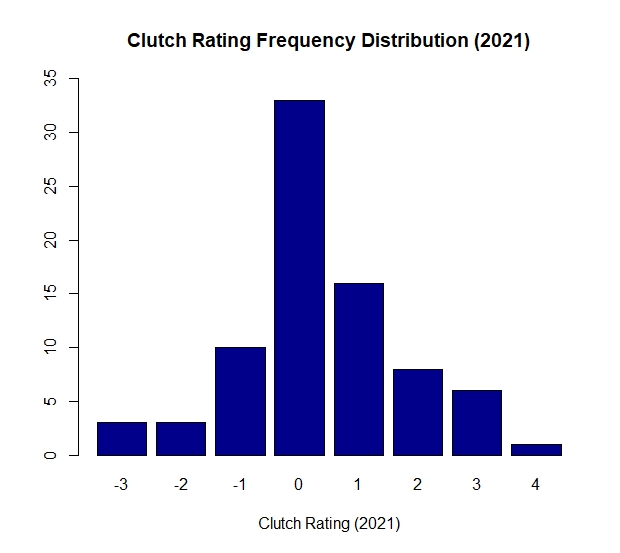
Clutch points are rarely a factor unless you play a lot of tournaments, but it might be interesting to see if these ratings predict or correlate with any measures of performance. In other words, does the Clutch rating tell us anything about how well the golfer does in other areas of his game? Stay tuned.
In 2021, Guido Migliozzi was the only player with a Clutch rating of 4. Three players had a Clutch (Choke?) rating of -3 (Christiaan Bezuidenhout, Victor Perez, and Lee Westwood).
Migliozzi’s rating is, perhaps, a bit surprising in that he didn’t actually have any tournament wins in 2021 and lost on the first hole in a playoff at the Betfred British Masters.
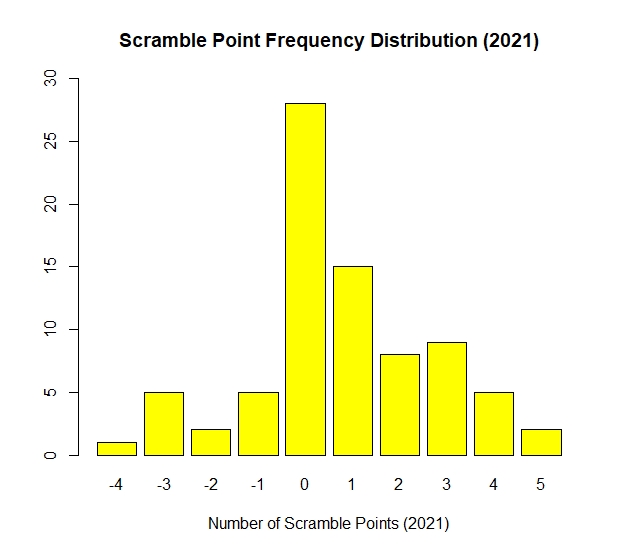
Scramble ratings vary widely from -4 to +5, but zero is most frequent. Lucas Herbert has the distinction of being the only player in 2021 to “earn” a -4. At the other end of the scale, Patrick Cantlay and Richard Bland are rated a 5.
Cantlay was ranked 1st in scrambling on the PGA Tour (67.30%), while Bland ranked 4th on the European Tour (66.83%) in 2021. By comparison, Herbert struggled around the green (46.36%).
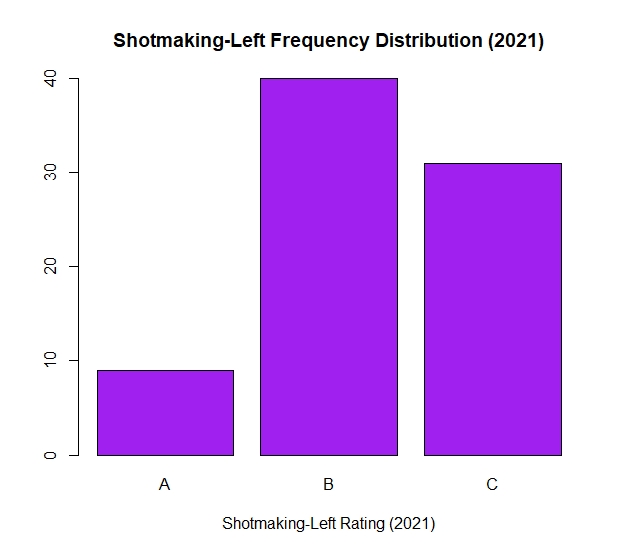
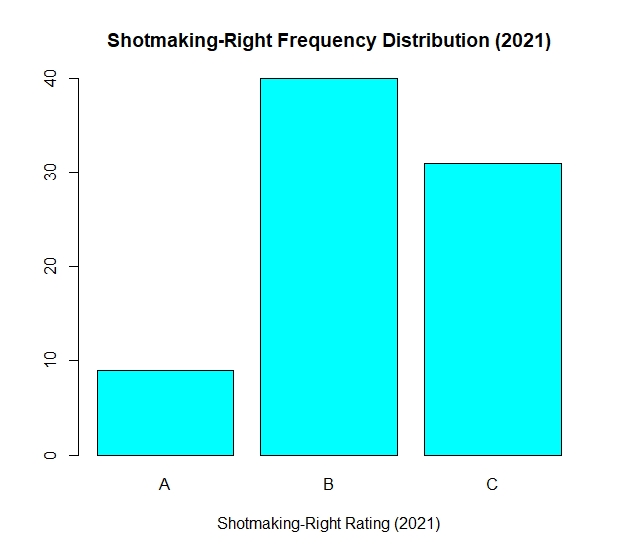
We musn’t forget Shotmaking ratings. As might be expected, “B” is the most common rating for Working-the-Ball Left and Right, and very few players receive an “A.” The two distributions are identical.
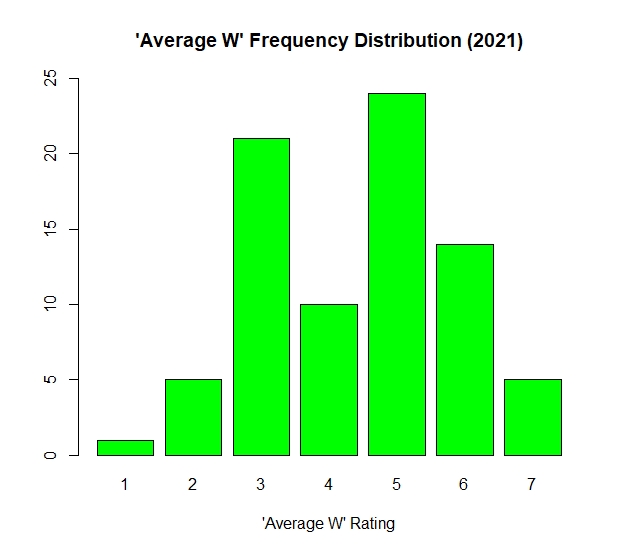
Lastly, we take a look at Average W/I ratings. ‘Average W’ ratings of 3 and 5 are most frequent, which may suggest an overall tendency for tee shots to go to the left with this group of players.
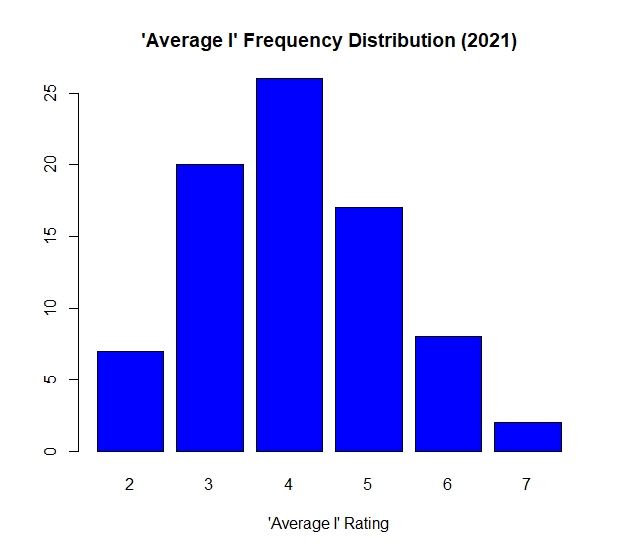
‘Average I’ ratings are more uniformly distributed. In both cases, I suspect the 2021 card set has more players with lower Average W/I ratings compared to those from years gone by. When I add some of my 20th-century seasons to the dataset, we can check that out.
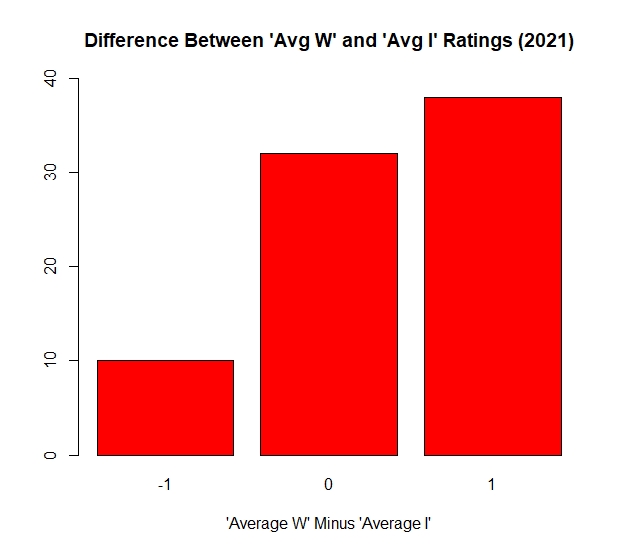
It’s also important to consider the difference between ‘Average W’ and ‘Average I’ ratings for each player. In general, there is an advantage to having an ‘Average W’ that is one number larger than the ‘Average I’ rating. Here are the Fairway carry distance differences between a 4I (W) and a 5I (I):
- ‘Average W’ is one number larger than the ‘Average I’: 5 yards
- ‘Average W’ is the same as the ‘Average I’: 10 yards
- ‘Average W’ is one number smaller than the ‘Average I’: 15 yards
The larger the difference, the more difficult it is to place a shot into the gap between those distances.
For the 2021 season, almost half of the players have an ‘Average W’ that is one number larger than their ‘Average I’. However, for 10 out of 80 players, the opposite is true.
In future posts, we’ll take a look at how all these ratings compare to performance measures as well as other card sets.
One thought on “Card Ratings – 2021 Season”