I am curious as to who putts the best among APBA golfers. While I have a fairly large dataset to work with (19,314 holes), most of the data in it consists of one or two rounds per golfer–not enough to draw meaningful conclusions from in terms of Putts per Round.
When I looked at all the golfers with three or more rounds, there was only one player in my dataset who made the Top 10 from a year other than 2019 or 2020–J. H. Taylor (1913). That surprised me, as I have 30 golfers from 2021 with at least three rounds played.
In fact, the Top 3 Longest Putts per Round are all from 2021:
1 – Daniel Berger – 71 feet
T2 – Russell Henley – 66 feet
T3 – Rory McIlroy – 66 feet
Since I wanted to compare my APBA data with PGA data, I decided to exclude old-timer Taylor from the analysis and raise the requirement to four rounds played. Here’s what I found:
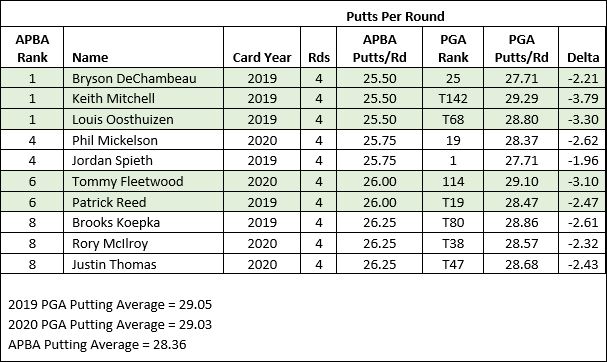
The very best APBA putters in my dataset are all from 2019: Bryson DeChambeau, Keith Mitchell, and Louis Oosthuizen (25.50 putts per round each) based on four rounds of play. While DeChambeau finished a respectable 25th overall in PGA rankings in 2019, Oosthuizen (T68) and Mitchell (T142) had nothing to write home about. In fact, Mitchell (29.29) was slightly worse than the PGA average (29.05) for that year.
Overall, my group of 426 APBA golfers has a Putting Average of 28.36 putts per round. This is based on every golfer’s performance (i.e., any number of rounds). Golfer’s with data for multiple card years were considered “different” golfers for each year.
Tentatively, there are at least a couple of conclusions we can draw from these findings. First, APBA golfers seem to putt better than PGA players, bearing in mind that APBA only creates cards for about 80 of the best players each season. It isn’t terribly surprising then that APBA putters, as a group, perform better than the PGA average. (This doesn’t even take into account that 144 of my APBA golfers are All-Time Greats.)
Second, there isn’t a great deal of correspondence between how individual APBA players putt and their real-life counterparts–at least when it comes to those farthest from the mean. This shouldn’t surprise us either, given the small sample sizes.
For the most part, sports simulations do a much better job of mimicking statistical results for teams or seasons than individuals. This makes perfect sense when you think about it. When you aggregate the data from individuals, as you do when comparing one team to another or one season to another, the effects of chance are greatly reduced (assuming your statistical model is any good at all).
This means that APBA tournament replays will seldom end up with the same winners as in real life, but the overall statistical results may look quite similar–especially if you control for factors like wind and course conditions.