This post is the first in a series for my replay of the 2025 U.S. Open at Oakmont Golf Club near Pittsburgh, represented in APBA as Steel City. The series begins with a detailed look at the tournament setup and will continue with round-by-round recaps. The replay will use the Game Caddie (currently, beta version 7.2) with its “Modern” distance setting, which better reflects today’s player W/I shot distances versus those found in the APBA Golf Game.
The 2025 U.S. Open, held June 12–15, began with a field of 156 players. One player withdrew after round 1 and another after round 3, leaving 66 players (i.e., qualifiers) who completed all four rounds. The cut line was +7. The replay will use the 66 players from the APBA 80-card set who competed in the tournament. To maintain a comparable sample size, all replay participants will play all four rounds.
One objective of this replay is to assess how well Steel City holds up as a model by observing its effect on scoring and overall realism. In particular, I want to see how well this APBA course simulates play tee-to-green and on the green. The replay setup is discussed in detail below.
Replay Rationale
Modern majors do not usually end this way. At the 2018 U.S. Open, Brooks Koepka did not overpower the field—he outlasted it, finishing at −1 as the only player under par. Every par mattered, and that kind of result sits at the edge of what the modern game typically produces. It was not about going low; it was about holding on.
Which is why what J.J. Spaun did at Oakmont in the 2025 U.S. Open stands out, and why it is worth taking a closer look at how it actually happened. Spaun also finished at −1, separating himself from a field that never collectively broke par. In an era defined by distance and scoring, that outcome does not simply win a major—it challenges how we think majors are won.
At first glance, the explanation seems straightforward. Oakmont is supposed to overwhelm players—heavy rough, limited rollout, survival golf—and that narrative fits the reputation. When the data are examined, though, that explanation begins to break down. The performance profile for the tournament does not reflect a course that prevented access to the green. As a result, we have a pretty big gap between expectation and outcome.
The purpose of this replay is to explore that gap. The goal is not to re-create every shot, but to test whether the same kind of outcome can be produced when the course is set up to reflect how Oakmont actually played. The approach is deliberate: identify where scoring separated from Tour norms, translate those effects into the model, and then observe whether the same pattern emerges.
The test is both analytical and experiential. Oakmont did not simply produce difficult scoring—it produced pressure that accumulated over time. Each round narrowed the margin, mistakes carried increasing weight, and even making par required discipline.
The question is not only whether the numbers align, but whether the replay produces the same sense of constraint and consequence. The analysis rests on a simple premise: The difficulty at Oakmont did not come from getting to the green; it came from what happened after.
2025 U.S. Open Tournament Metrics — By the Numbers
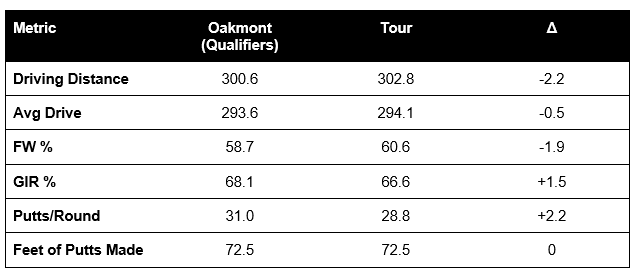
From the table above, it appears that the green access metrics hold. Driving distance is effectively unchanged, fairways are only marginally lower, and greens in regulation are actually higher. By those measures, players are reaching greens at least as effectively as they do under standard Tour conditions. That result does not align with a course suppressing ball striking, and yet scoring was worse.
If access is not the issue, then conversion must be. Putting provides the answer, but not in the usual sense.Total feet of putts made is identical to the Tour average, which indicates that players are not performing worse in aggregate. They are converting the same total distance, but they are taking more putts to do it.
That difference matters. More putts with the same total distance implies longer first putts, fewer realistic birdie opportunities, and a greater reliance on recovery putts. Players are reaching greens, but not in positions that allow them to finish efficiently. This exemplifies how the course is applying pressure.
Tightening the Screws on Scoring
To understand how scoring evolved over the course of the tournament, I’ll focus on qualifiers. The full field includes players who missed the cut, which introduces volatility tied to one or two rounds rather than sustained performance. Qualifiers provide a cleaner view of how the course played over time, because those are the players who were able to navigate the conditions across all four rounds.
Here is a breakdown of the scoring between the field and the qualifiers:
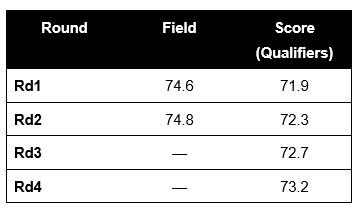
The field averages in the opening rounds reflect the full effect of Oakmont on all players, including those who would not advance. The qualifier data isolates those who were able to sustain performance, making it the better measure of how the course tightened over time.
Within that group, the pattern is consistent. Scores rise each round, even though external conditions remained stable. There is no weather shift driving the increase and no measurable drop in tee-to-green performance that would explain it. Instead, the same level of ball striking produced progressively worse scoring outcomes.
That shift suggests that the course is tightening as it should–day after day. The difficulty is not in reaching greens, but in converting once there, and that difficulty increases as the tournament progresses.
Setting Up the Replay Conditions
Weather conditions were steady throughout the week with moderate temperatures, light winds, and no sustained precipitation. As a result, the replay will use Normal course roll conditions and Calm winds throughout. W/I club distances will not be adjusted (beyond using the “Modern” setting), since the 2025 tournament shot data do not support it. But hole lengths will be modified each round, based on those actually used during the tournament.
Per the APBA terrain notes for Steel City: Shots that land or roll into the rough are limited to no more than five yards of rollout and are played as buried lies with a 3-iron club maximum. Fairway bunkers are treated as poor lies, reducing precision even when the player is technically in position. Ditches are treated as water hazards, with the option to play them as deep rough, introducing risk without forcing a penalty. These restrictions do not prevent players from reaching greens, but they do introduce friction that must be managed so as not to shift difficulty away from the greens.
Fifteen of the eighteen holes include additional putting instructions tied to pin location. Combined with pin placements away from the center line, these increase first-putt distance, reduce make probability, and raise the likelihood of three-putts. This aligns with what the data suggest—players are reaching greens, but they are not finishing from positions that allow efficient scoring.
The replay model has multiple ways to apply pressure on the greens. Pin placement is one. Steel City’s built-in green rules are another. A third option would be to use the Major Championship putting boards, which are designed to increase putts per round due to more demanding conditions.
The issue is that not all of those mechanisms are independent. The data show that total feet of putts made remained consistent with the Tour average, while putts per round increased. That pattern points to longer and more difficult first putts, not a general decline in putting performance. The pressure came from position and conversion, not from an across-the-board reduction in make probability.
At Steel City that same effect is already being introduced through pin placement and the additional green instructions applied to fifteen holes. Adding Major Championship putting boards on top of those effects would compound the result and push putting beyond what the data support. For that reason, the model will use the Original putting boards and allow difficulty to emerge from how the greens are set up.
Modeling to Apply Pressure on the Green
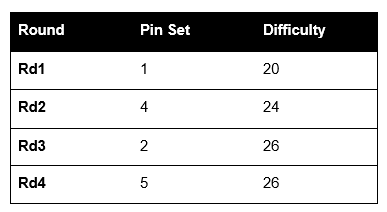
Pin placement becomes the primary mechanism for controlling how pressure is applied on the greens. Each hole is assigned a specific pin location, and each location is evaluated based on its position relative to the center line of the green and the terrain around it.
The grading is defined as follows:
0 — No more than one square from the center line, and all points around the location are on the green
1 — No more than one square from the center line, and one or more points around the location are not on the green
2 — At least two or more squares from the center line
The difficulty of all possible pin locations for each hole was summed using the above criteria, and the four most difficult are shown in the table below (higher = harder):
As the mix shifts toward more demanding positions, the margin for error shrinks and conversion becomes more difficult, mirroring the scoring pattern observed in the tournament. This model has been applied successfully in multiple tournament replays, consistently producing realistic scoring outcomes, most recently in my replay of the 2024 PGA Championship at Valhalla (Bluegrass).
To recap: Oakmont does not defeat players by keeping them off the green. It defeats them by making greens matter more. This replay is designed to test whether that outcome can be re-created in APBA Golf by simulating conditions as similar as possible to the 2025 US Open at Oakmont.