This is the second of two posts on my replay of the 2021 PGA TOUR Championship. Yesterday’s post described the actual tournament and the results of the replay in round-by-round fashion. Today’s post provides a closer statistical comparison and explores the significant impact of putting factors.
As with any simulated tournament, the results are always affected by the relatively small sample size as well as any variables that make the replay circumstances different from the actual event (e.g., wind, course conditions, pin location). Nevertheless, I am always impressed at the general consistency of statistical results between APBA simulations and the actual events, and this tournament was no different.
Overall Comparison Between Replay and Actual Results
The table below provides a macro comparison of the replay and actual events.
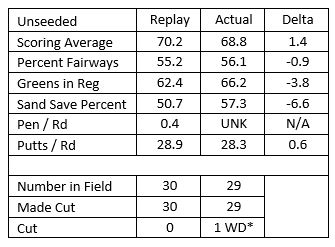
*Brooks Koepka withdrew in the 3rd round
Here are a few takeaways:
- The replay players shot an average of 1.4 strokes higher than the actual players. Putts per round accounted for 0.6 of them, about 40 percent.
- While fairway accuracy was similar, the actual players hit a few more greens in regulation, and were better getting up and down, especially from the sand. (Peachtree has a number of deep greenside bunkers, which by course rules are always a buried lie.)
- The PGA doesn’t report penalty numbers, so a comparison for that stat is not possible.
Hole Difficulty
This is how the two tournaments played in terms of hole difficulty.
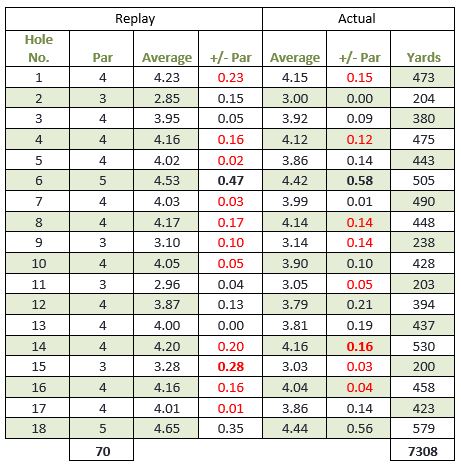
The 209-yard No. 15 island green hole drew more than its fair share of water balls in the replay, and the uphill, longish No. 1 (with OB in play down the entire left side and no assured bail out right) were the two most difficult holes in the replay. Holes 1 and 14 were the toughest for the actual players.
No. 15 in APBA is difficult because of its ~200-yard carry over water, which dictates a long iron or FW wood off the tee for all but the longest hitters. Use of long irons and FW woods eliminate the possibility of a knockdown shot to protect against a prevailing cross wind. In addition, any miss with a long iron or wood is at least 20 yards left or right, taking the shot almost assuredly into the water.
While the course boards do not provide for it, I used a drop area left and short of the green, which still required the next shot be hit over the water but from only about 50 – 80 yards out, depending on pin position. The actual players didn’t have many serious problems with this hole, though.
The complete set of GCRB replay reports is shown below. Click the pop-out button in the upper righthand corner to view them all.
Putting Factors
Putting is such a big part of the game. In the replay, I used APBA’s regular putting boards. Although there were no really bad putters in the replay, several carded players had the ability to miss short putts and did so.
The greens at Peachtree don’t have any special instructions that make them more difficult as some courses do. Since APBA offers just a “safe” and “go” option and there were no other factors to consider, plain old dice-rolling luck comes into play in a more obvious way than in other parts of the game.
In 2021, the average tour pro took 29.0 putts per round. In the actual tournament, the field averaged 28.3. This means that the 29 best players in the world averaged only 0.7 fewer putts per round at East Lake than the entire tour across all its events. The replay players averaged 28.9 putts. While a significant factor in the overall scoring difference for this event, the replay putting was generally in line with what tour pros do on a week-in and week-out basis.
Pin placement is a major factor in putting, and thus, scoring overall. Consider the table below:
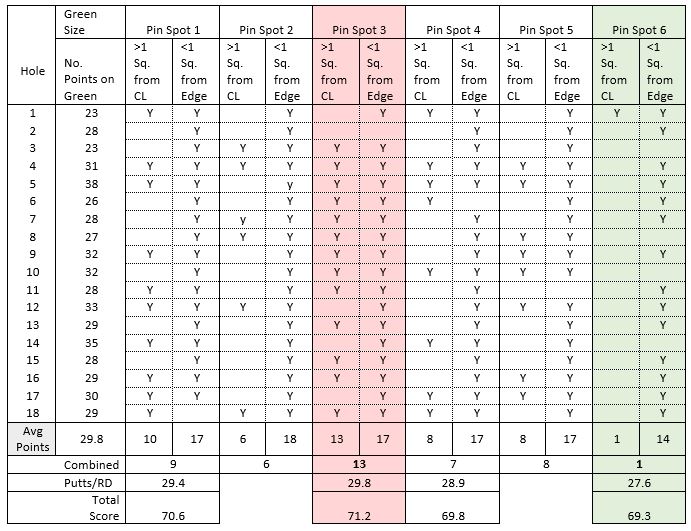
To create this table, I counted the total number of points (i.e., intersecting lines) on the green for each hole. The average number of points for Peachtree is 29.8. For comparison, Seaside’s average is 15. Let’s put this factor aside for the moment, since I plan to come back to it in a later post on green size and scoring for all the APBA courses that I own and have sufficient scoring data to analyze.
To establish the difficulty level for a particular pin placement, I counted up the number of times each pin location was more than one square from the centerline (CL) and those times it was less than one full square from the edge of the green. Then I counted up the situations when both conditions were true, and I recorded the Combined total.
My theory is that the fewer the Combined locations, the easier it is to get closer to the pin when on the green. In APBA terms, that means the chances for sinking the putt improve and miss distances decrease, thereby making a possible next putt more makeable. All that should result in fewer putts per round.
As we can see in the table above, Pin Spot 6 only had 1 such location, and the putts per round (27.6) were the lowest in the event (as was the average score for that round–69.3). By contrast, Pin Spot 3 had 13 such locations and putts per round (29.8) were the highest for the event (as was the average score–71.2). Pin spots 1 and 4 fell in line, accordingly.
A corollary to my theory is that pin locations can have a marked effect on scoring results for medium to large greens and that the effect would decline as greens become smaller. In a subsequent investigation, I will look at this and also the effects of rough and hazards abutting greens.
Since pros hit about 2/3 of their greens in regulation, recoveries from poor lies should increase distance to the pin on the next shot about 1/3 of the time, and thus, increase total putts. These and other considerations will be left for later study.