This post examines how realistic APBA Golf is by comparing certain statistics between the actual 2023 PGA Championship and my replay of it. For the replay setup and results, please consult the Recent Posts section.
The 2014 Master Game rules were followed with two exceptions:
- Balls landing on tree squares were subject to a “homebrew” tree-bounce rule (as described on the Caddie Notes tab of the Game Caddie).
- Clutch putting in the final round applied to the last three holes of the tournament for everyone in the Top 10 from the previous round.
My analysis will include an investigation of four statistics: Driving Distance (2 Drives), Driving Distance (All Drives), Putts per Round, and Total Distance of Putts Made. The approach consists of comparing the actual results with the replay results. As always in such analyses, certain caveats apply. These include:
- The sample of qualifiers and replay players are not entirely identical. The replay group consisted of the 70 carded APBA players in the 2023 season set who played in the tournament. The 76 actual qualifiers included some players not carded by APBA.
- The analysis is based on data from only one tournament with limited wind and course conditions.
Comparison of Four Replay Rounds and Tournament Totals
With the weather conditions relatively stable and benign across all four days of the tournament, replay results were reasonably consistent as well. In the actual event, a light rain fell on days 2 and 3. The replay simulated the weather by making the course Soft on day 3 ( -5 yards to FW rolls / No change to Green Roll). A summary of the replay is provided in the table below.
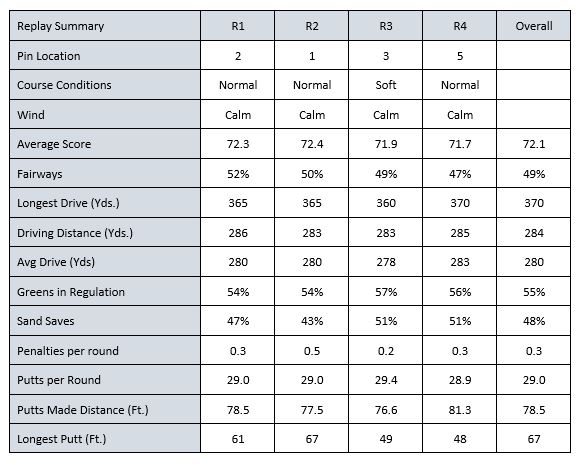
With par set at 70, the average replay score hovered around two strokes over par across all four days and resulted in an average of 72.1 strokes for the tournament. While Driving and Putting statistics remained relatively consistent, two trends for these stats are worth mentioning:
- As expected, Average Driving Distances declined somewhat with Soft conditions on day 3.
- Despite a small decline in the Fairways Hit percentage as the tournament progressed, Greens in Regulation percentages improved a little over the course of the tournament, probably a result of learning how to best play Acorn Hill (Oak Hill). Unsurprisingly, as Green in Regulation percentages improved, average scores declined somewhat.
Actual vs Replay Average Statistics
The table below provides a comparison of the actual qualifier’s and replay player’s overall statistics.
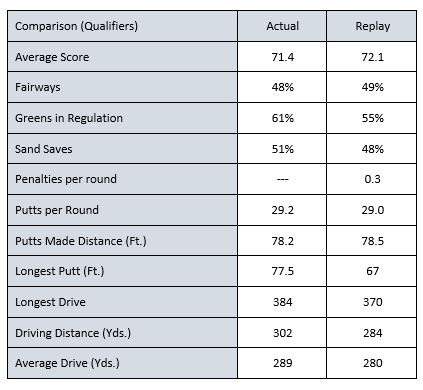
As can be seen, the replay players (72.1) averaged 0.7 strokes higher than the actual qualifiers (71.4). Since the replay players (with 29.0 Putts per Round) putted 0.2 strokes better on average than the actual qualifiers (with 29.2 Putts per Round), the actual qualifiers played on average 0.9 strokes better tee-to-green per round.
Since the PGA doesn’t report penalty strokes in its online data, no comparison is possible for that stat. Yet, the data show the replay players hit fewer greens by 6 percentage points (55% vs. 61%). Fewer greens hit means more approach shots, and thus more strokes taken tee-to-green.
Now, let’s look at the distribution of outcomes for selected statistics between the actual qualifiers and the replay group.
Driving Distance
The Game Caddie captures Driving Distance stats in two ways:
- Driving Distance (2 Drives) – tee shots on two user-selected par 4 or par 5 holes
- Driving Distance (All Drives) – tee shots on all par 4 and 5 holes
The 2023 tour averages were:
- Driving Distance (2 Drives) – 299.9 (~300) yards per drive
- Driving Distance (All Drives) – 291.9 (~292) yards per drive
- The difference was about 8 yards per drive, with the 2-Drive metric being longer
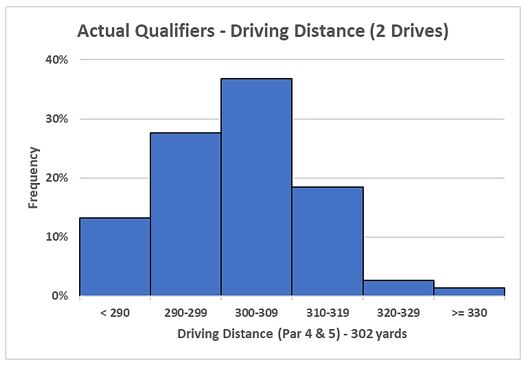
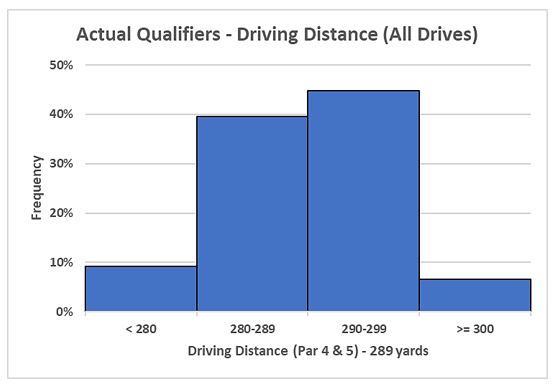
For the 2023 PGA Championship Tournament at Oak Hill, the average results were:
- Driving Distance (2 Drives) – 302 yards per drive
- Driving Distance (All Drives) – 289 yards per drive
- The difference was about 13 yards per drive, with the 2-Drive metric being longer
The distributions of driving distance at Oak Hill are shown below.
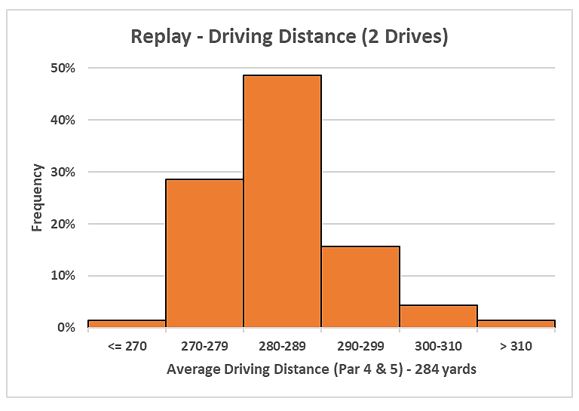
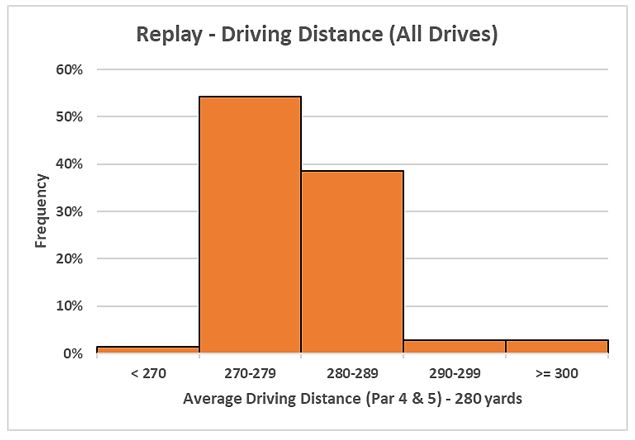
For the replay the Average Driving results were:
- Driving Distance (2 Drives) – 284 yards per drive
- Driving Distance (All Drives) – 280 yards per drive
- The difference was about 4 yards per drive, with the 2-Drive metric being longer
The distributions of driving distance at Acorn Hill are shown below.
A comparison of all these Driving Distance Averages is shown in the table below.
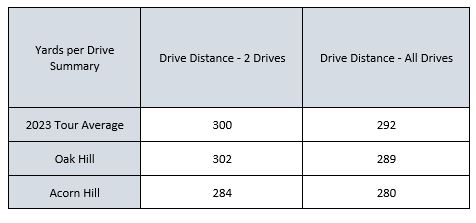
The replay players drove the ball about 16 – 18 yards shorter on average (using the 2-Drive metric) and 8 – 12 yards shorter (using the All-Drives metric) than did the actual qualifiers and the 2023 Tour pros. Notwithstanding the average distance differences, the similarity of the shapes of the distributions in the graphs suggest that the driving distance process (ranging from shorter to longer hitters) in the replay generally matches that of actual PGA golfers.
Based on the All-Drives metric, the data suggest that the 2014 APBA Golf shot charts for drives has the current set of carded players hitting the ball about 10 yards shorter on average than the current set of TOUR professionals. The 2-Drive metric would suggest more than a 15-yard difference, yet is less reliable because the metric is subject to small sample size variation and highly dependent on which two holes are selected for a particular course.
In the replay, hole nos. 9 and 18 were used for the 2-Drive measurement. The holes selected for the actual tournament were not reported in the stats provided on the PGA website.
Putting
The differences in putting performances were quite small. Putts per Round in the replay averaged 29 putts and in the actual event 29.2. The replay used the Regular Putting boards and followed the rules on the course boards that increased putting difficulty on selected holes by one Play Result Number (PRN). For example, a PRN of 20 becomes a 21. In addition, the Total Distance of Putts Made stat matched quite closely: 78.2 feet (actual) vs. 78.5 feet (replay).
Recall from the Set-Up section, an algorithm assigned difficulty points based on hole locations from off the centerline (CL). A summary of the algorithm and the putting results from the replay are shown below.
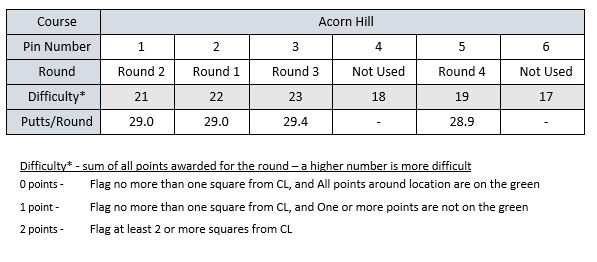
Note that the higher the difficulty score, the higher the number of putts per round. While there was only a small amount of variation in difficulty among pin placements for this replay (28.9 – 29.4), the final results shown in the table are both encouraging and consistent with the findings of my previous LPGA replay at Metro D.C.
Summary
The big takeaway from this analysis is that the APBA Golf game does a great job of simulating most of the statistical parameters of events played with the same players under the same course setup conditions.
For Acorn Hill, a long course with very tight fairways, short- and medium-length players struggled hitting greens, in part, because of a 7-iron restriction that applied to all shots from regular rough. In my opinion, this course terrain rule is too harsh and results in some APBA golfers performing worse than they would in reality (i.e., lower GIR percentages).
There are at least a couple of workarounds for the Game Caddie user who agrees:
- Ignore the max 7-iron from the regular rough rule.
- Enforce the rule but use the Alt Distance Tool on the Course tab to allow players to hit their shorter irons farther. To do that, you’d need to enter some “extra yardage” value into the 5I-9I and PW-SW boxes but still restrict yourself to a max 7-iron.
While it can be challenging to break par on Acorn Hill, it is beautifully rendered and can be played fairly easily with the Game Caddie. Just be sure to put some thought into which clubs you put in your bag. Otherwise, you’ll feel downright helpless in some situations.