This post is the last in a 6-part series on my replay of the 2022 Women’s PGA Championship at Metro D.C. (Congressional Country Club’s Blue Course). The initial post detailed the day conditions, the rationale for choosing pin locations, and hole-length adjustments. All of these were chosen in order to more closely match the actual tournament. Later posts did a round-by-round comparison of the replay with the actual event. (See round results 1, 2, 3, and 4.)
Metro D.C. plays as a par 72 (as does Congressional). The replay contestants for all four rounds consisted of the 42 APBA-carded players who played in the actual tournament, whereas the actual event had 71 qualifiers after the cut. Both groups averaged 73.2 strokes per round for the 72-hole tournament. This post analyzes how these two groups of players arrived at that result.
Game Caddie 6.1 was used throughout the replay to facilitate gameplay and to collects stats. The 2014 APBA Master Game rules were followed with two exceptions:
- A fan-favorite, tree-bounce rule was implemented (as described on the Notes tab of the Game Caddie).
- Clutch putting rules in the final round applied to the last three holes of the tournament for the top ten finishers from round 3 and not just those players with a putt for the lead or tie for the lead in the final round.
One further change was made. Dr. Tom Cline’s carry and roll adjustments for particular holes were applied in addition to those appearing on the APBA course boards. These adjustments can be found among the hole notes for Metro D.C. in the Game Caddie.
Comparison of Four Replay Rounds and Tournament Totals
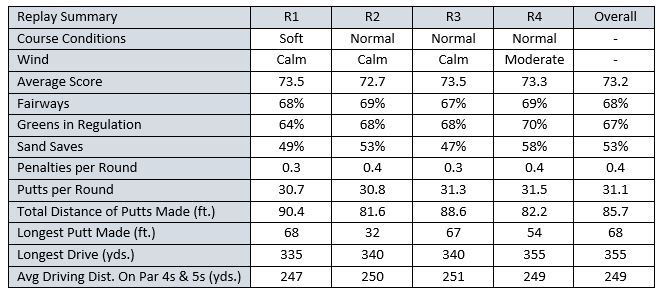
In terms of conditions, both the actual tournament and replay started off on a Soft track and finished with Normal roll conditions and Moderate wind. In the replay, average scores held fairly steady, varying from a low of 72.7 strokes in round 2 to a high of 73.5 strokes in both rounds 1 and 3. This produced an overall average for the replay of 73.2 strokes.
- Fairways: Replay players hit fairways at a steady rate, varying from a low of 67% in round 3 to a high of 69% in both rounds 2 and 4. This resulted in an overall average for the replay of 68% of fairways hit.
- Greens in Regulation (GIR): Replay players’ GIR percentages increased steadily from 64% in round 1 to 70% in round 4, resulting in an overall average of 67% for the replay. Interestingly, the highest percentage occurred during round 4, which had moderate wind that usually makes for more, not fewer, missed greens. Since I had not played Metro D.C. very much previously and not with the women professionals until this tournament, the higher GIR% for round 4 may be due to a practice effect.
- LPGA Length Adjustments: The APBA rules for LPGA golfers reduce carry by type of club used (e.g., -30 yards for a wood) but do not adjust roll or the maximum left and right tendencies of a shot. For instance, a PRN of 21 with an LPGA player on a drive will fly 240 yards (30 yards shorter than the 270-yard carry listed on the shot boards), yet still travel 50 yards left and roll 30 yards unless it encounters unfavorable terrain or course-specific adjustments. Women also play shorter hole distances than men. This means making some adjustments when planning where tee shots can be expected to land. While the Game Caddie handles all the math, it still took me a while to make the necessary mental shift from familiar men’s club and hole distances to women’s.
- Sand Saves and Penalties: Sand Save percentages varied moderately from round-to-round, averaging 53% for the tournament. Penalties per round changed very little between rounds, resulting in a final average of 0.4 penalty strokes per player per round. (Surprisingly, the LPGA does not report penalty strokes in their official tournament summaries.)
- Putts per Round: The number of putts per round for rounds 3 and 4 were at least a half-stroke higher than in rounds 1 and 2, resulting in an average of 31.1 putts per player per round for the entire replay. The increase in putts in later rounds was expected. More difficult pin locations were purposely selected for rounds 3 and 4, as described in the post on course setup.
- Average Driving Distance: Game Caddie 6.1 introduced a new feature to capture average driving distance on par 4 and par 5 holes. Round 1 had Soft course conditions, which reduced fairway roll. As the course dried out, the conditions transitioned to Normal roll. The lowest average distance was 247 yards in round 1. The highest average distance was 251 yards in round 3. The tournament average driving distance was 249 yards.
Actual vs. Replay Average Statistics
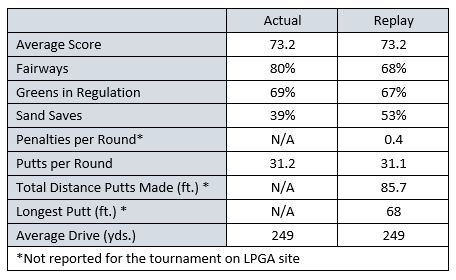
As mentioned above, total average scores were 73.2 strokes for both the 71 actual qualifiers and 42 replay participants.
While the actual qualifiers were far more accurate off the tee (80%) than the replay group (68%), it’s hard to say exactly why. Here are some things to consider:
- Course Rendering: Metro D.C. has fairly wide fairways. The course is drawn just a bit tighter than APBA’s original version of Magnolia (i.e., Augusta National), whose fairways are commonly recognized to be wide. Examining fairway width, say at 275 yards off the tee, is one way to think about it. With moderate variation among holes, Magnolia’s average fairway width on par 4 and par 5 holes at that location is about 34 yards, while Metro D.C.’s is about 31 yards. With a good drive, left or right dispersion for a Driver is equal to or less than 15 yards on the shot board. Teeing off with a 3W typically cuts down dispersion by 5 yards. When aiming off the tee to the middle of the fairway with no wind, good drives should find the fairway most of the time. Thus, fairway widths as drawn for Metro D.C., are not likely to be the main reason for the difference.
- Left/Right Dispersion on Play Result Numbers (PRNs): While the ladies carry the ball shorter distances for the same club and PRNs as the men, they hit the ball the same distance left or right as the men. The overall average driving distance was the same (249 yards) for replay players and actual qualifiers, which suggests carry and roll aren’t the main reasons for missing fairways. All that remains is that the replay players hit their drives farther left and right more often than the actual qualifiers. Figuring out exactly why requires additional research.
Despite missing the fairways substantially more often, the replay players found the greens only just a bit less frequently than did the actual qualifiers: GIR: Actual (69%) vs. Replay (67%). The difference in average number of putts per player per round was negligible: Putts/Round: Actual (31.2) vs. Replay (31.1). With identical average scores and nearly the same number of putts per round, the fewer GIRs hit by the replay players means they were better at getting up-and-down when a green was missed.
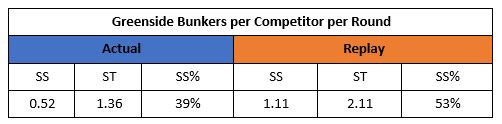
An example of where the replay players outperformed the actual qualifiers around the green is seen in the Sand Save statistic: Sand Saves: Actual (39%) vs. Replay (53%).
The table below provides a comparison of the actual qualifiers and replay players overall averages.
Actual vs. Replay Distributions
The previous section examined actual qualifier and replay player overall averages. This section focuses on a discussion of distribution outcomes for selected statistics between the two groups. See my earlier post for an example of what you can learn from examining these types of data.
Driving
- Accuracy – Fairways
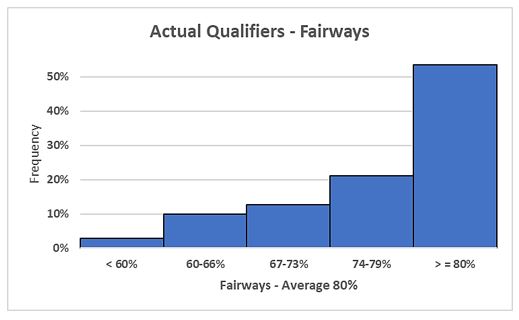
As shown below, just over half the actual qualifiers hit the fairway 80% or more of the time. The rest of the field was short of that mark to varying degrees.
For the replay players, about a third of the field hit between 67 – 73% of the fairways, with the remaining field distributed on either side of that bracket as seen below.
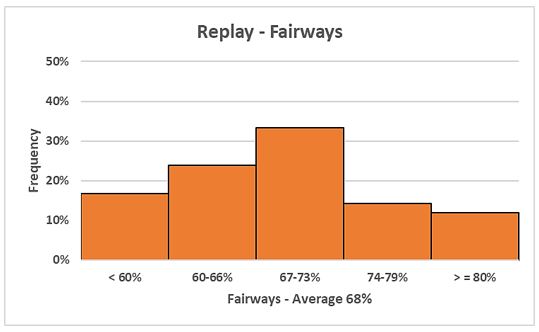
Not only were the Fairways Hit average percentages different between the actual qualifiers (68%) and replay players (80%), but the results were distributed differently, as reflected in the shapes of the two charts above. The differences in averages and the very different shapes of the distributions suggest that the two driving accuracy processes may be different.
- Average Driving Distance
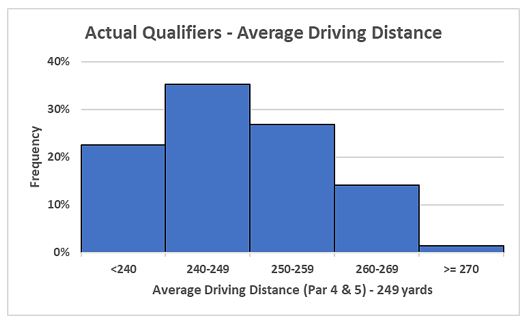
As shown below, about a third of the actual qualifiers drove the ball between about 240 – 249 yards. About 20% of the field was shorter than that distance, and the rest were longer to varying degrees. The overall average was 249 yards for the actual qualifiers.
For the relay players, a little over 40% of the field hit between 250 – 259 yards on average. About half of the field hit shorter than that and fewer than 10% hit longer as seen below. The overall average was 249 yards for the replay players.
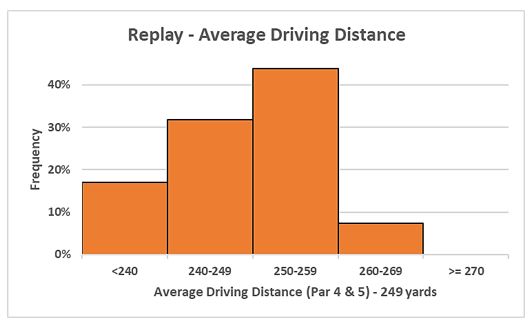
The fact that the average driving distance was the same for the actual qualifiers and the replay players and that the general shapes of the two group’s distributions were somewhat similar supports the notion that driving distances for the replay mirrored the actual event reasonably well.
Approach Game
This section of the review examines the topics of hitting greens in regulation and getting up-and-down from greenside bunkers.
- Greens In Regulation
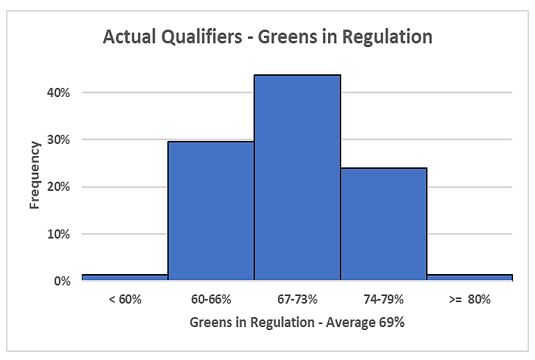
As shown below, a little more than 40% of the actual qualifiers hit between 67% – 73% of the greens in regulation. The remaining portion of the field was distributed on either side of that bracket. The overall average was 69%.
For the replay group a little more than 40% of the field hit between 60% – 66% of the greens in regulation. The remaining portion of the field was distributed mostly towards the higher brackets as seen below. The overall average was 67%.
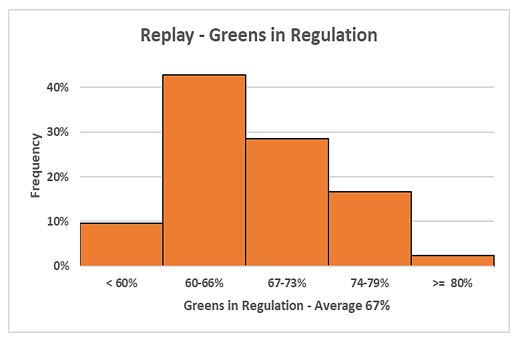
The fact that the replay players were approaching the green from off the fairway more frequently than the actual qualifiers likely explains why the replay players hit the greens less often. With the shapes of the distributions shaped similarly (although skewed a bit differently), nothing otherwise in the data suggests that hitting Metro D.C.’s medium-to-large greens was any more difficult for replay players than for the actual qualifiers.
- Greenside Bunker (i.e., Sand Trap) Play
Metro D.C.’s greenside bunkers are standard sand traps and, for the most part, are positioned adjacent to the greens. None of them are deep bunkers; nor do any have special terrain rules that add difficulty when playing out of them. It takes a pretty good approach shot to stay out of the sand when multiple traps are located near the pin.
As shown in the table below, the replay group (2.11) found greenside bunkers over one-and-a-half times more often than did the actual qualifiers (1.36). The replay group also had about twice the number of Sand Saves per player per round: Replay (1.11) vs. Actual (0.52). While the replay group found the greenside bunkers more often on shots that missed the green, the replay group’s superior ability to get up-and-down from greenside bunkers helped them hold down their scores.
Putting
In the actual tournament qualifiers averaged 31.2 putts per round, which is higher than the LPGA average of 28.4 putts per round in 2022. Since Metro D.C. has no special course board rules that make putting more difficult, the replay used the more challenging Major Tournament Putting boards and distal pin placements to make putting as difficult as possible.
Recall from the setup post, an algorithm assigned difficulty points based on hole locations from off the centerline (CL). A summary of the algorithm and the putting results from the replay are shown below.
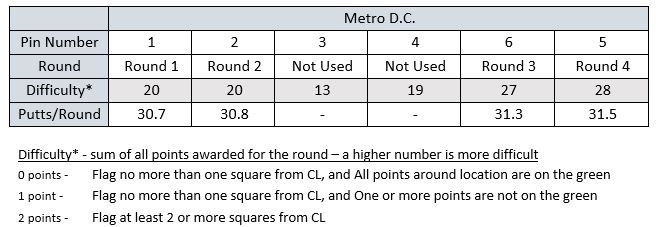
As predicted: the higher the difficulty score, the more putts per round on average. The overall replay average was 31.1 putts per round, which compares favorably with the actual average result (31.2). Previous analysis has shown that the Major Tournament Putting boards can add about 2 strokes per round to a player’s score vs. the Regular Putting boards. While the sample size here is too small to draw strong conclusions about the validity of the algorithm or the number of putts added per round by use of it, the final results are encouraging.
- Hole Difficulty Comparisons
The course set up for the replay was based on the total yardage for the actual tournament: 6894 yards. Once the pin locations for the replay were chosen (1, 2, 6, & 5), the following hole-length adjustments were applied: -30 yards for par 5’s, -20 yards for par 4s, and -10 yards for par 3s. The results are shown in the table below in columns 4, 5, 6, & 7 from the left. This method produced a course length of 6903 yards, which closely approximated the actual reported length (a difference of 9 yards).
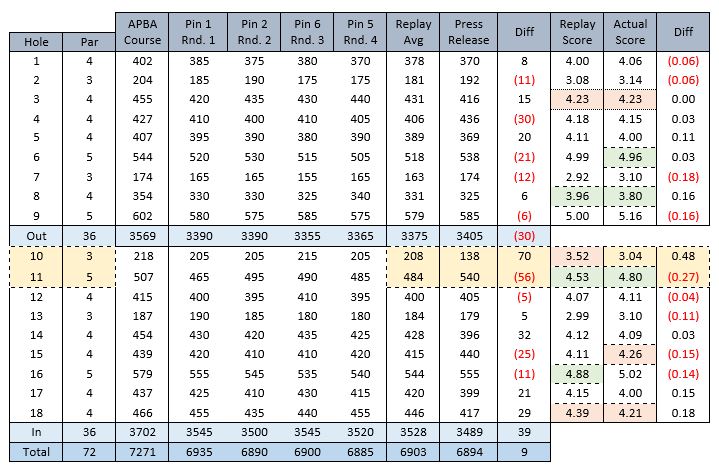
An internet search during round 3 of the replay uncovered a press release with the actual course setup for the tournament, which agreed with the total yardage reported on the tournament’s wiki page. The table above provides actual hole yardages in the fifth column from the right, titled Press Release.
As shown in the far-right column of the table, the method produced a fairly accurate way to compare hole difficulty, except for holes 10 and 11, where the tournament officials did more than just move up the tees to accommodate LPGA golfers.
Hole 10 in the actual tournament was played from 138 yards–not 208 yards, which was the average for the replay. This hole is a long carry over water to a green, though wide, has little depth. Only the longer hitters had a chance to keep the ball on the green, and anyone landing short of the green almost always ended up in the drink.
To make things fairer, I set up a drop area about 50 yards short and left of the green. That location required a shot (albeit less risky) over water as well. Even so, in the replay, hole 10 played about a half-stroke over par (+.52).
By contrast, hole 11 in the replay was a very reachable 484-yard par 5. In the 2011 men’s U.S. Open, this hole played as a 494-yard par 4. In the actual 2022 Women’s PGA Championship, a longer tee was used; the hole played as a par 5 at 540 yards. As a short par 5, the replay players averaged nearly a half-stroke under par (-.47). The easiest and hardest holes were as follows:
The three easiest holes:
- Actual: hole 11 (-.20), hole, 8 (-.20) and hole 6 (-.04)
- Replay: hole 11 (-.47), hole 16 (-.12), and hole 8 (-.04)
The three hardest holes:
- Actual: hole 15 (+.26), hole 3 (+.23), and hole 18 (+.21)
- Replay: hole 10 (+.52), hole 18 (+.39), and hole 3 (+.23)
In terms of holes that played over par in the replay, hole 10 had the most bogeys (and was second in double bogeys or worse), and hole 18 had the most double bogeys or worse (and was tied for third in bogeys).
Summary
As I have found true in my previous replays, when the conditions and the course are set up to closely match the actual event, the APBA-carded players who played in the event and the actual qualifiers perform similarly as groups. Individual performances will vary, yet good players will generally play well.
Typically, APBA doesn’t card the weakest players, yet those golfers do find their way into actual tournaments and on rare occasions do well. APBA season card sets (45 for women and 80 for men) seldom match an actual tournament’s field size. Thus, a perfect apple-to-apples statistical comparison at the tournament level is hard to reproduce.
What I like most about APBA Golf is the range of strategies and shot choices that capture real golf’s essential elements, such as: integrity, focus, determination, excitement, joy, and disappointment. While the Game Caddie can automate aspects of the game to save time and generate a lot of stats, it is not lost on me that APBA Golf, at heart, is a great board game that offers a feel for what it might be like to play golf at its highest level. This replay is a prime example of that.