For a couple of years now, I have been sharing the results of my APBA Golf play on this site’s Downloads page. At the end of each month, I had been updating that Excel file with every hole I played by myself or with others.
As I write this, there are stats for more than 39,000 holes in my database. But my guess is that even the most avid APBA Golf fans don’t care that much about hole data, except for the occasional hole-in-one. What is potentially far more interesting is round data.
So, I have decided to stop posting the file with hole data on this site, and instead, make my round data available in Excel format. You might ask, “What kinds of things could I do with that?” Depending on your Excel skills and curiosity, quite a lot.
Let’s say, you have just completed a difficult round, repeatedly scrambling from sand traps around the green. You wonder how your “day at the beach” compares to many other rounds that have been played. This happened to me recently, where Leona Maguire (2022) ended up in green-side bunkers seven times at Metro D.C. (Congressional). I wondered, what is the most times that’s happened in a single round?
After a quick sort of RoundGSB in this dataset, I learned that three other players had rounds where they got caught in green-side bunkers eight times: Paul Runyan (1934) at Gopher Lakes (Hazeltine National), Brooks Koepka (2019) at Seaside (Pebble Beach), and Marc Leishman (2020) at The Stadium Course (TPC Sawgrass). To make matters worse, Leishman was 0 for 8 in Sand Saves that day! (By comparison, Maguire had 5 sandies.)
While we’re on the subject of bad outings, what’s the most penalty strokes in a round by one golfer? After a quick sort of RoundPen, we see that Abraham Ancer (2020) leads in that category. On April 30, 2021, he had five penalty strokes at The Stadium Course, despite a Calm day.
Assuming you play APBA Golf even casually, you might wonder about typical scores on particular courses and how yours compare. You might also wonder about the effects of wind on round scores for that course.
Let’s take Birthplace (St. Andrews) as an example. Birthplace is unique in several respects. One of them is that wind effects (by course rule) are determined before each shot. That means you can have a lot of wind, but you know in advance what you are dealing with when selecting clubs and targeting shot locations.
Using Excel’s Data Analysis command button, you can quickly generate descriptive statistics (in this case, for Round Scores by Wind Day Conditions). The image below shows how wind affects scoring at Birthplace in this dataset.
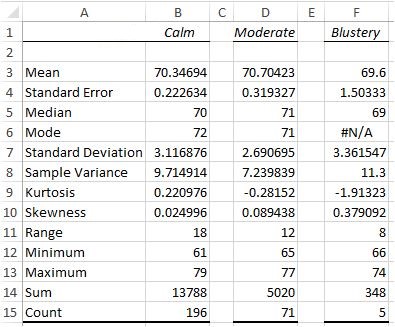
We see that average scoring is actually lowest for Blustery conditions (69.6), although that’s based on a measly number of rounds (5), and therefore, might not mean much. There are many more rounds for Calm (196) and Moderate (71) conditions with a relatively small difference in Standard Error (0.096), so we should have more confidence in these two averages. The mean score under Moderate wind conditions at Birthplace is only slightly higher than when winds are Calm (Calm = 70.3 vs. Moderate = 70.7).
We could test for statistical significance using Excel, but I won’t go down that cart path today. Just eyeballing these numbers, we can tell that wind isn’t much of a factor in terms of scoring at Birthplace–probably for the reasons already mentioned.
These are but a few examples of how you can use this spreadsheet. Hopefully, the field names are self-explanatory but let me know if you can’t figure them out. And be sure to let me know if you discover anything interesting or break any of these records! I’ll give you a shout-out here.
As before, I’ll update this Excel file at the end of each month. You can find it on the Downloads page under the link called Scott’s GCRB Database.